Pinterest Analytics for Beginners: How to Actually Read Your Numbers
Pinterest analytics can feel like a wall of scary numbers. It’s not. Here’s the beginner-friendly tour — what each metric actually means, which ones to ignore, and how to turn your data into decisions.

The first time you open Pinterest analytics, it can feel like being handed the cockpit of a plane. Impressions, engagements, saves, pin clicks, outbound clicks, audience insights, conversion data — a wall of numbers and charts, all seemingly important, none of them explained. So most beginners do one of two things: they either obsess over the numbers daily and drive themselves crazy, or they close the tab and never look again. Both are mistakes. The truth is that Pinterest analytics is actually simple once someone shows you which handful of numbers matter and what they mean. Let me be that person.
Here’s my promise for this post: by the end, you’ll be able to open your analytics, glance at five numbers, understand exactly what they’re telling you, and know what to do next. No overwhelm, no cockpit. Just a friendly, useful skill you’ll use for the rest of your Pinterest life. Grab your coffee.
The five metrics that actually matter
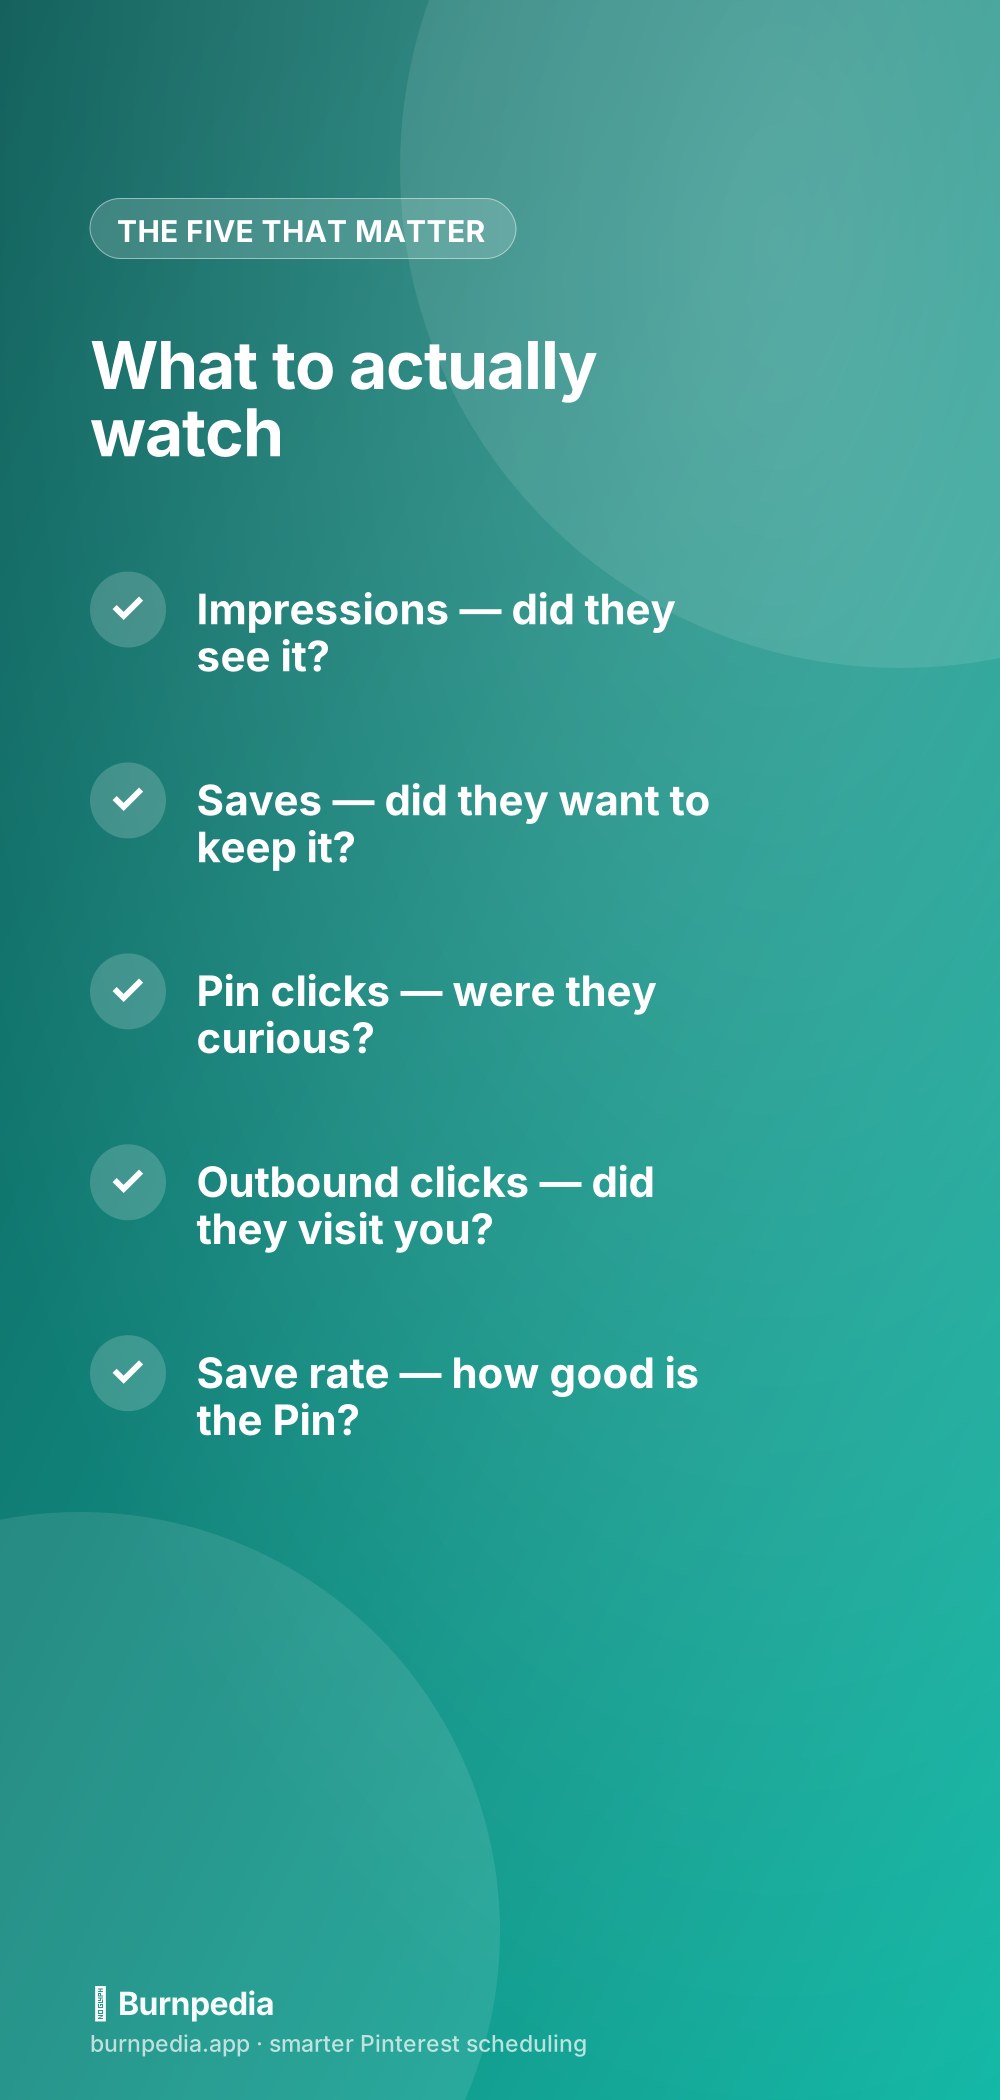
Pinterest gives you a lot of metrics, but you only need to understand five to run your account well. Everything else is either a variation of these or something you can safely ignore as a beginner. Let’s go through them in plain English, in the order they happen when someone encounters your Pin.
- Impressions — how many times your Pin showed up on someone’s screen. This is reach: did people see it at all? A high number here just means you were visible, nothing more.
- Saves (sometimes called “saves” or “repins”) — how many people bookmarked your Pin to a board. This is the big one for a beginner, because it means your content was worth keeping. Saves also help your Pin spread, since it now lives on someone else’s board too.
- Pin clicks — clicks to see your Pin up close (a “close-up”). This signals curiosity: your image and title made someone want a better look.
- Outbound clicks — clicks that actually left Pinterest and went to your website or shop. For most of us, this is the money metric — real traffic, real people on your site.
- Save rate — saves divided by impressions, as a percentage. This tells you how good the Pin itself is, independent of how many people saw it. A small Pin with a great save rate is a hidden winner.
That’s genuinely it for the essentials. If you want to go a little deeper on why saves and clicks beat raw reach, I unpack it in impressions vs. engagement — but the five above are your foundation.
The metrics you can (mostly) ignore for now
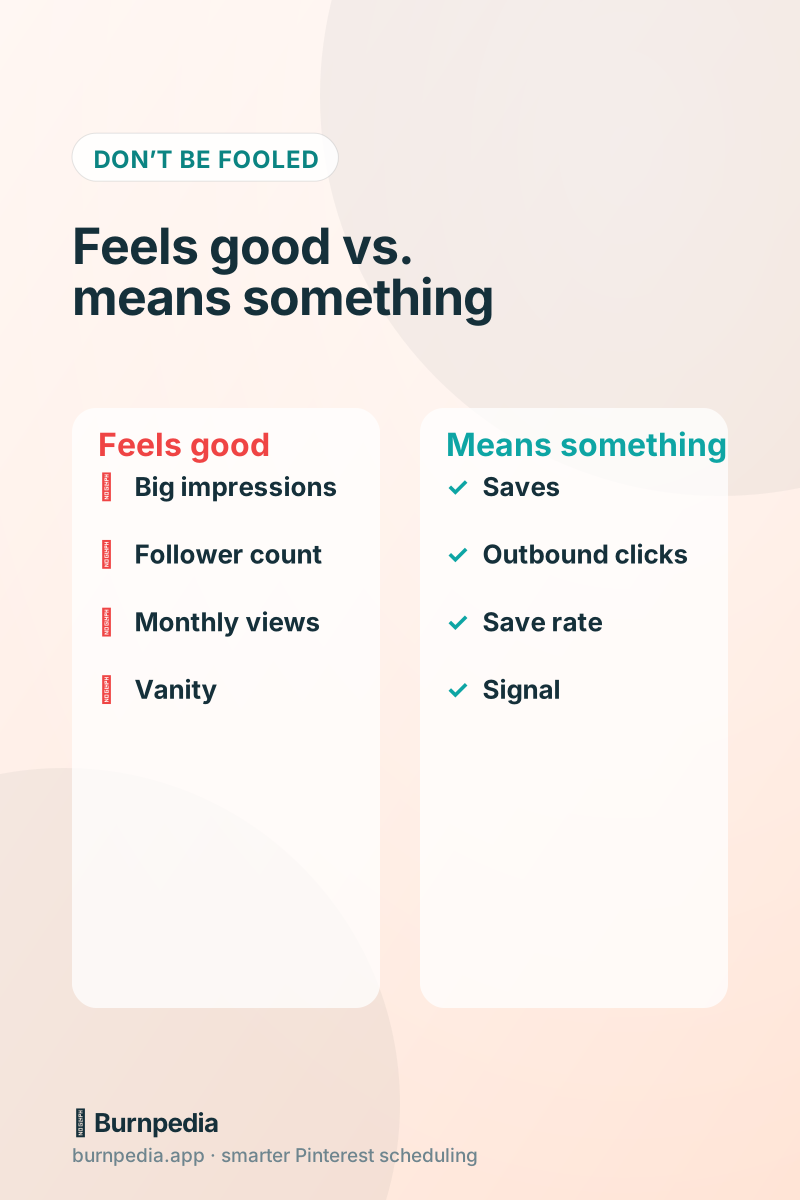
Just as important as knowing what to watch is knowing what to ignore, because chasing the wrong numbers wastes energy. As a beginner, don’t stress about your follower count — Pinterest is a search engine, not a social network, and Pins reach people through search and recommendations far more than through followers. Don’t obsess over “monthly views,” the giant number on your profile; it’s mostly a vanity figure that includes every fleeting impression and rarely reflects real results.
These are the classic vanity metrics — they feel amazing when they’re big and crushing when they dip, but they rarely tell you to do anything different. I go deeper on separating the signal from the noise in the metrics that matter. For now, just gently ignore the vanity numbers and keep your eyes on saves and outbound clicks.
How to actually read your data (the 3-question method)
When you open your analytics, don’t just stare at the numbers — ask them questions. I use three. First: “Is my reach growing over time?” Look at impressions week over week; a gentle upward trend means you’re building momentum. Second: “Are people engaging?” Look at your save rate and outbound clicks; this tells you whether your content resonates, not just whether it’s seen. Third: “Which specific Pins are winning?” Find your top performers and study what they have in common.
That third question is the most valuable thing a beginner can do. Your own top Pins are a free lesson in what your audience wants. Maybe your list-style Pins crush your quote Pins, or a certain color palette keeps winning, or one topic outperforms everything. Once you spot the pattern, you make more of what works — that’s the entire game, and your analytics just handed you the answer.
Compare over time, not in isolation
A single number means almost nothing on its own. “200 outbound clicks this month” — is that good or bad? You can’t know until you compare it to last month. So the most useful habit is always looking at change over time. Is this week better than last week? Is this month up from the one before? Trends tell the story; snapshots just tempt you to panic or celebrate for no reason.
One thing to know: Pinterest’s analytics only reach back about 90 days for account metrics. So if you care about longer trends — season over season, year over year — you’ll eventually want to jot your numbers down monthly or pull them into your own tracker. If you’re handy, you can even automate that; I show how in the guide to building your own Pinterest analytics dashboard, but honestly, a simple monthly note in a spreadsheet is plenty to start.
Turning numbers into decisions
Analytics are only worth checking if they change what you do. So build in the “so what.” If your reach is flat, ask whether you’ve been posting consistently — often the fix is simply pinning more regularly. If a Pin has tons of saves but few outbound clicks, your Pin is great but your landing page or link might be weak. If one topic dominates your top Pins, lean into it. Every metric is a prompt; the growth comes from acting on the prompt, not from admiring the chart.
A lot of beginner “analytics problems” are actually just consistency problems in disguise — the numbers are flat because the pinning is sporadic. If that’s you, don’t feel bad; it’s the most common issue there is, and it’s eminently fixable. I list it among the scheduling mistakes to avoid, and the fix is almost always “post steadily,” which a scheduler makes effortless.
A simple weekly analytics routine
Here’s the whole practice, and it takes five minutes. Once a week — not daily, please, Pinterest is a slow game and daily checking just stresses you out — open your analytics. Glance at your five metrics versus last week. Note whether reach and outbound clicks are trending up. Peek at your top Pins and ask what they have in common. Then make one small decision: more of a winning topic, a tweak to a weak landing page, a bit more consistency. That’s it. Close the tab and go make Pins.
Analytics aren’t a test you can fail or a cockpit you need a license to fly. They’re just your account, quietly telling you what’s working so you can do more of it. Learn to read five numbers, check them weekly, and let them steer your next move. Do that, and you’ll grow faster than people with ten times the data and none of the discipline. Simple beats fancy, every time. — Sadie
Written by Sadie Brooks
Hey — I’m Sadie. I grew up in a small town outside Columbus, Ohio, moved to Austin for a job I quit within a year, and somewhere in between I started a scrappy little food blog to keep myself sane.
These days I help creators, bloggers, and small U.S. business owners grow on Pinterest without turning it into a second full-time job. I write the Burnpedia blog because I genuinely love this stuff, and because I wish someone had explained it to me in plain English years ago. Pour a coffee, pull up a chair.
Try Burnpedia freeWant Pinterest to run itself?
Every tip on this blog gets easier when your Pins publish on schedule. Burnpedia batches, times, and posts them for you — start free, no credit card.
Try Burnpedia free